Ayman Ouadoul


Final-year Business Intelligence student at Clermont School of Business, currently available for work.
Focused on data structuring, modeling, and analysis, with experience in interfaces and digital experiences.
I build the layer between raw data and the decisions it should drive — the pipelines that clean and model it, and the dashboards that make it readable. My work sits across Business Intelligence, data engineering and frontend development, which means I can take a dataset from its source files all the way to a screen someone actually uses.
In practice that means structuring and modelling data, building ETL/ELT pipelines, designing star schemas, and turning what comes out into dashboards people can read without a manual. The clearest example is further down this page: a 112,650-row Brazilian marketplace dataset taken from nine raw CSV files to three published Tableau dashboards.
Away from coding, I keep a strong connection to creative work through my background in sound design and digital marketing. I enjoy creating visuals and shaping ideas into engaging experiences, bringing a creative perspective to the way I approach branding, communication, and detail.
I'm a final-year Business Intelligence student at Clermont School of Business, looking for a BI or Data Analyst role. Analytics is the core of what I do — but it rarely stops at the dashboard. I also build what sits around the data: web apps with a real backend, AI and automation wired into existing SaaS workflows, and the front-end, from product interfaces to client-facing sites, that makes all of it usable. That range is deliberate, and the projects I'm shipping next are built to show it.
SQL, Power BI, Tableau, Looker Studio, Databricks, dbt, BigQuery, Snowflake, Plotly, Matplotlib.
Python, FastAPI, PostgreSQL, Supabase, SQLite, REST APIs, OpenAPI, Webhooks.
JavaScript (ES6+), TypeScript, React, Next.js, Vite, HTML5, CSS3, Tailwind CSS, Framer Motion, GSAP, Git/GitHub, REST API Integration.









A few tracks I keep in rotation while I work.
Data-driven products, built end to end — an AI web app, a business intelligence workspace, and a website running in production.
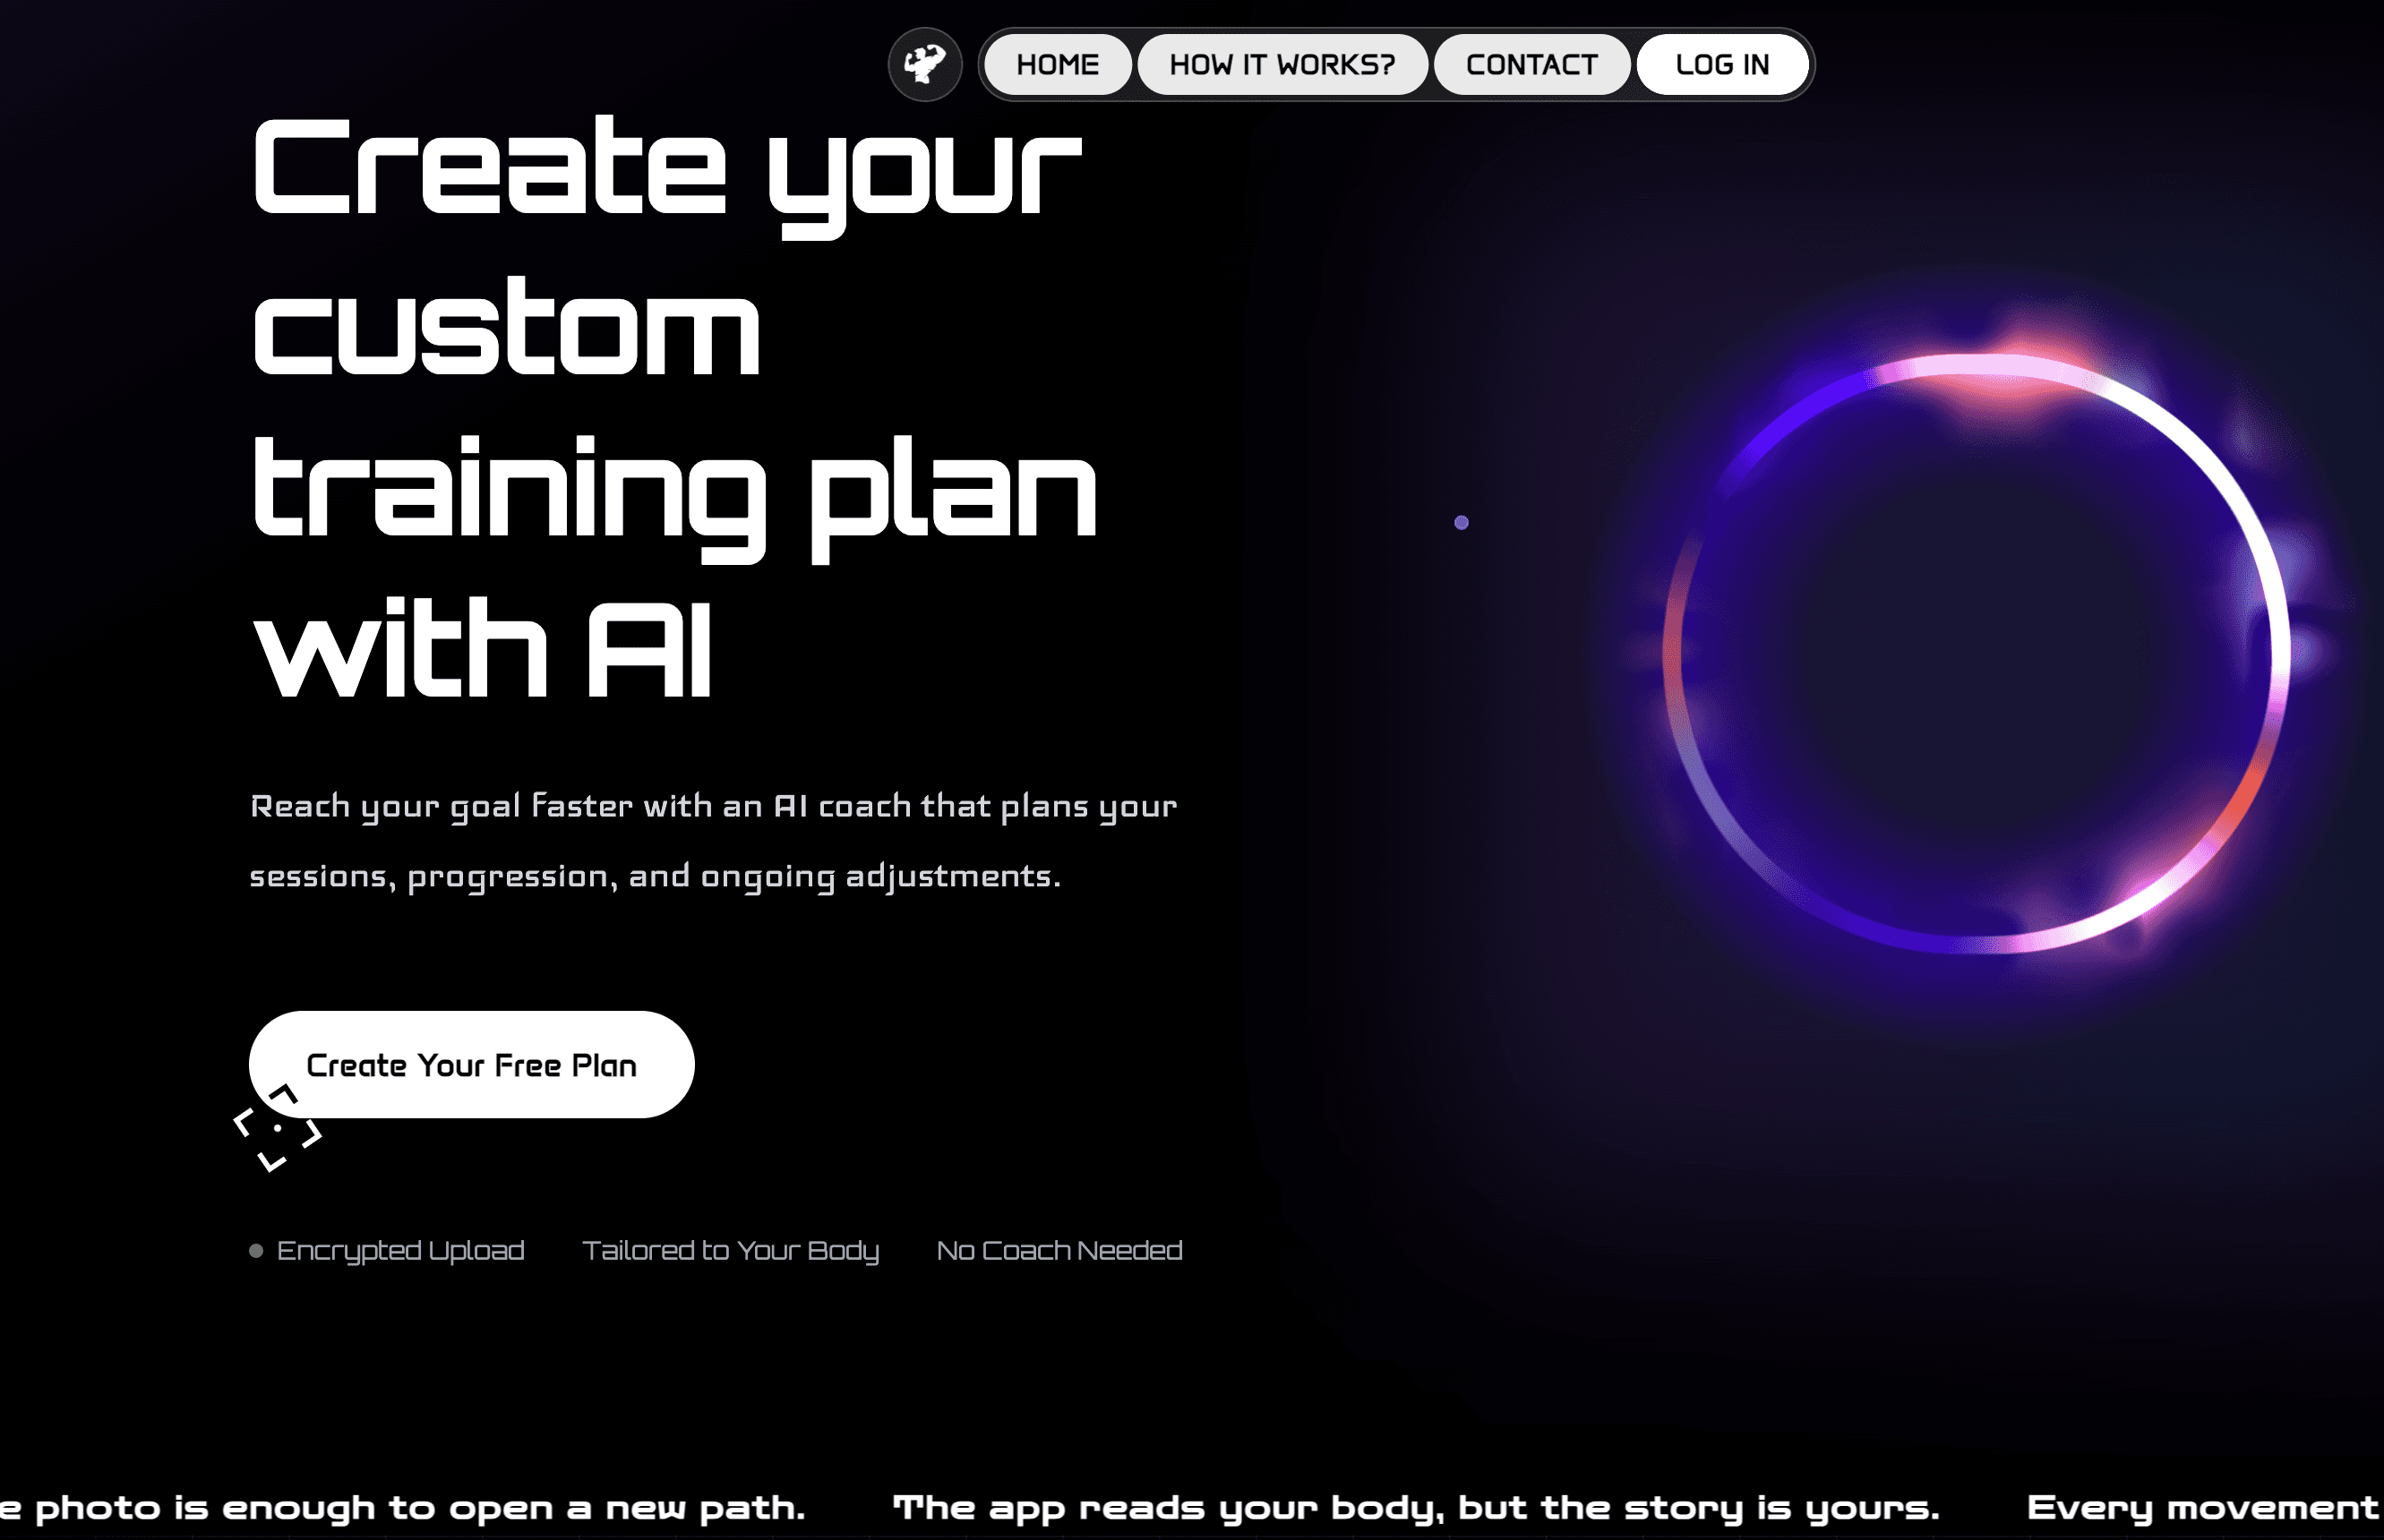
Snap & Train is an AI-based fitness application designed to analyze users’ posture and body proportions from uploaded photos, then generate a personalized 7-day training plan they can follow and track step by step.
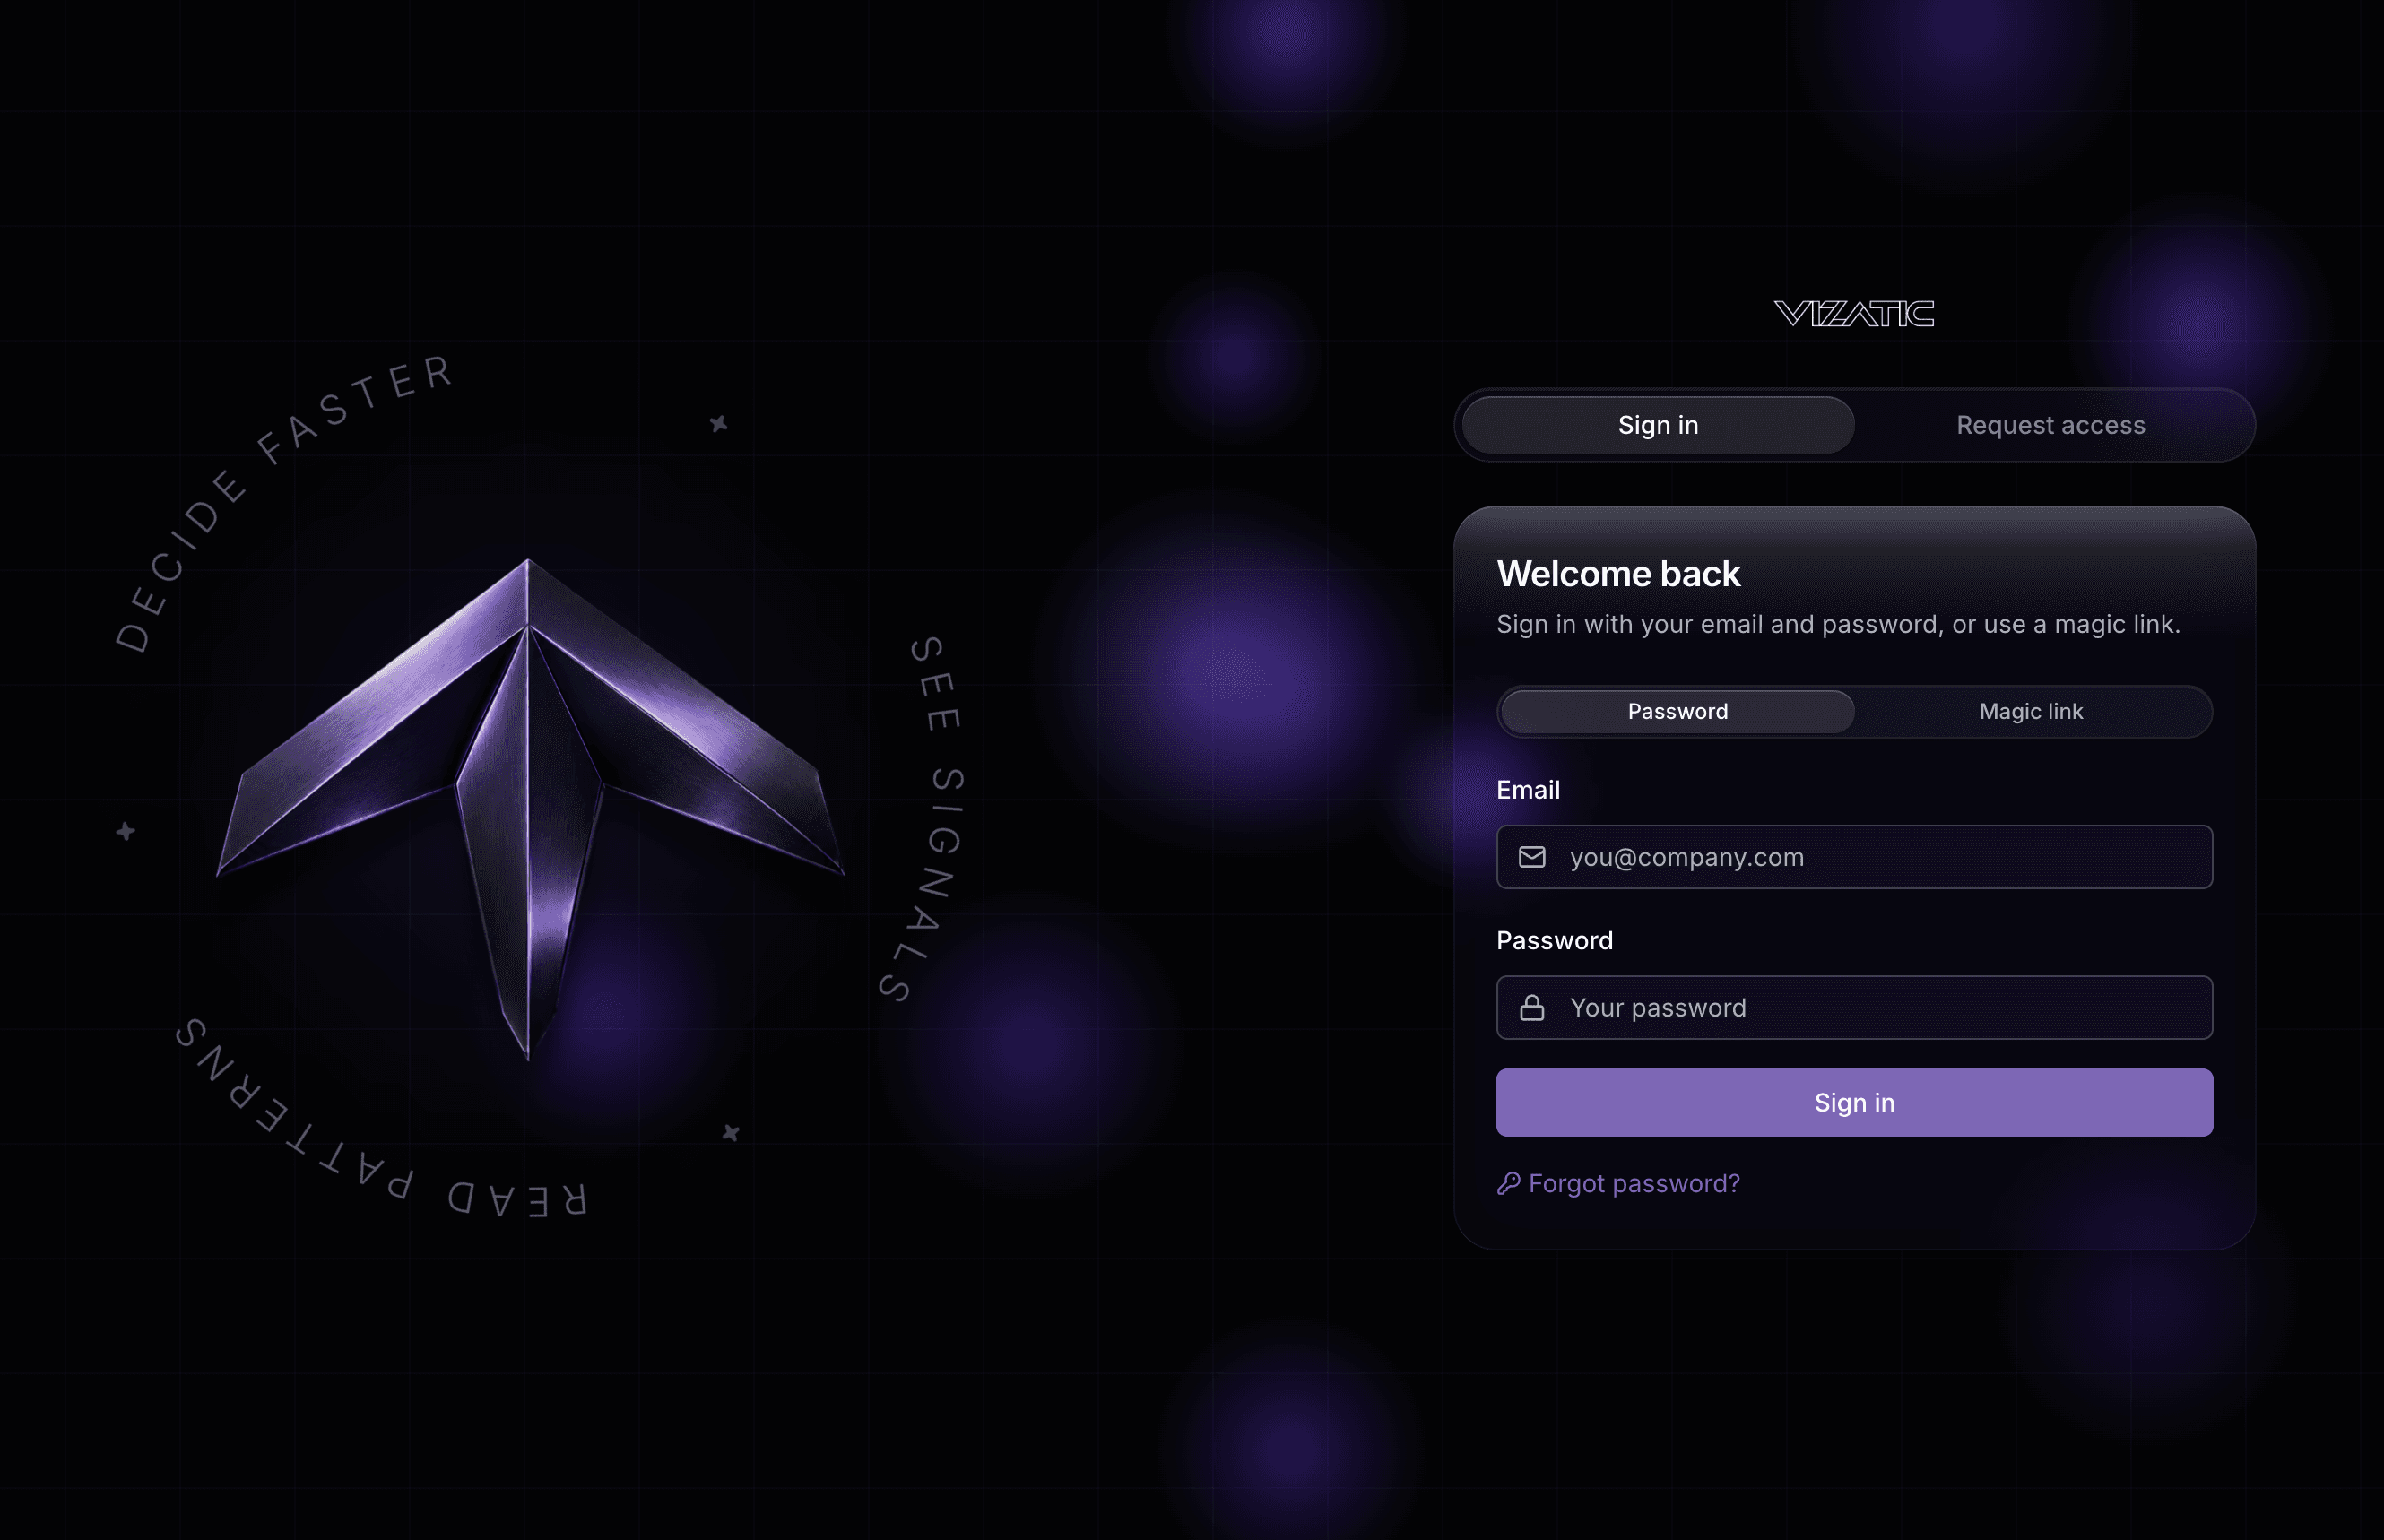
Vizatic is a Business Intelligence workspace designed to turn raw, disconnected datasets into clean, structured and analysis-ready data. Users can prepare their data, connect multiple tables, define business fields, and generate dashboards and AI-assisted insights from the final dataset.
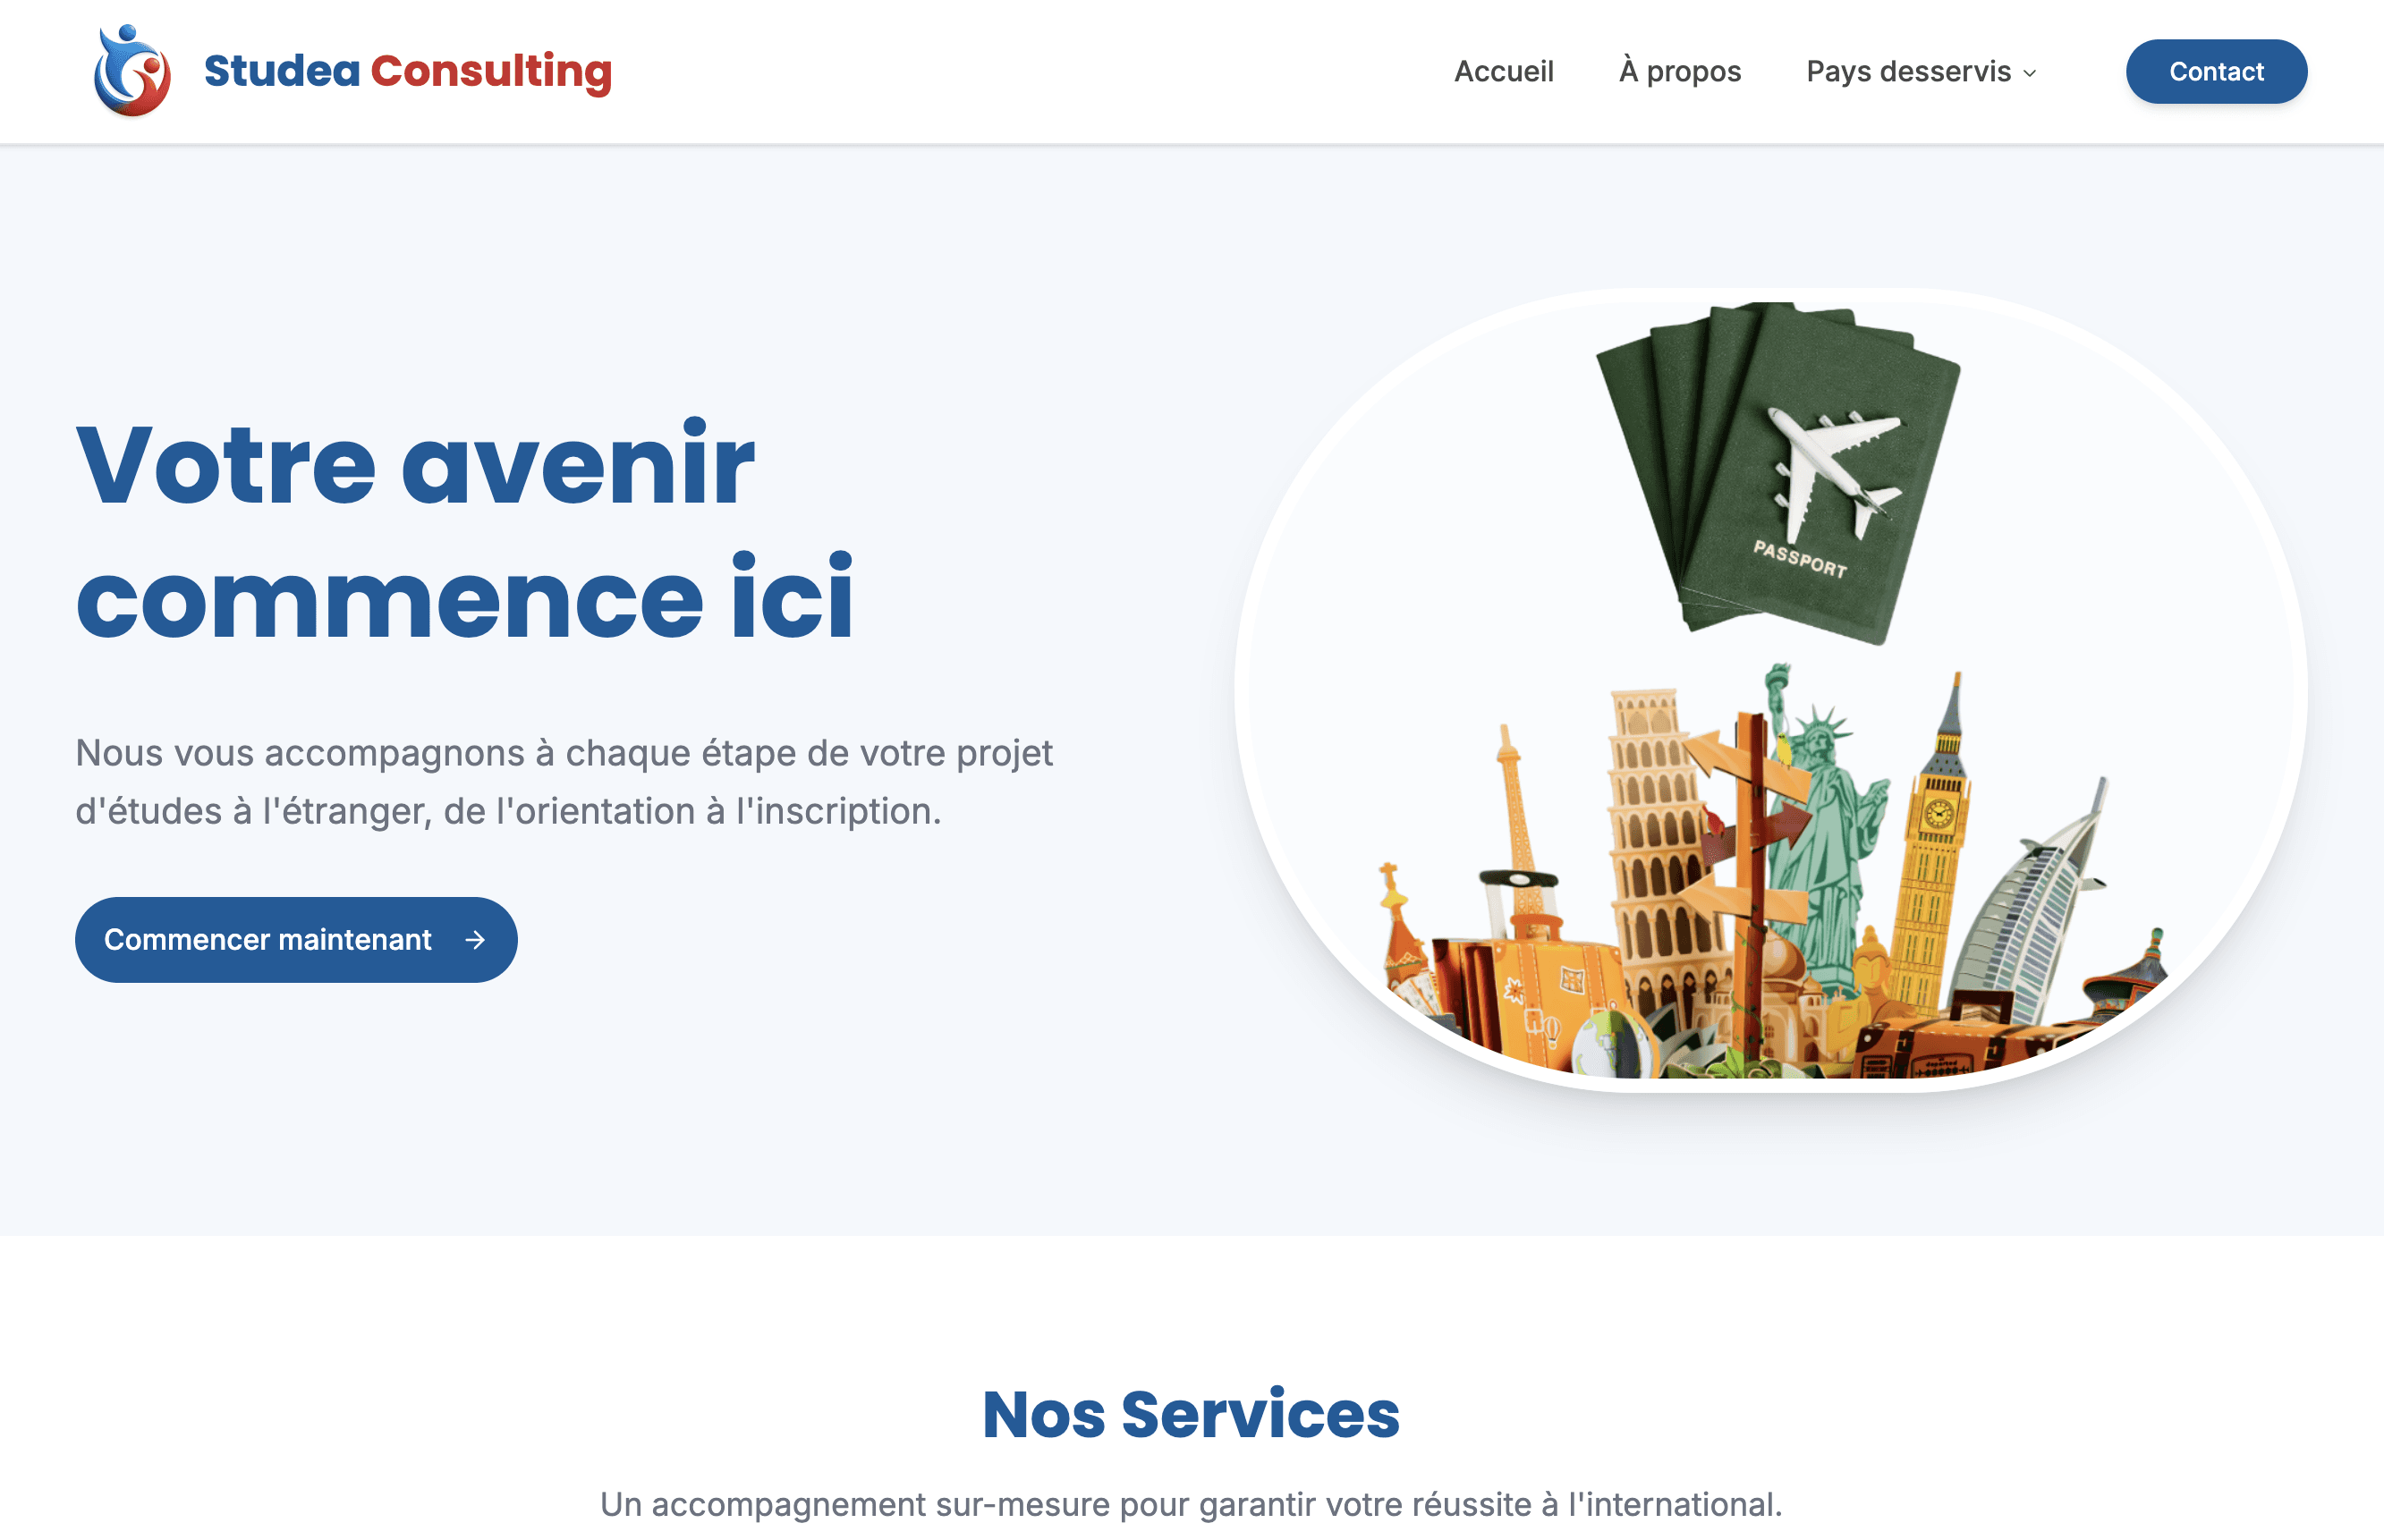
Studea Consulting is a production website built for an education consulting firm, designed to present study-abroad services, destinations and partner universities while giving students and families a clear path to information and personalized support.
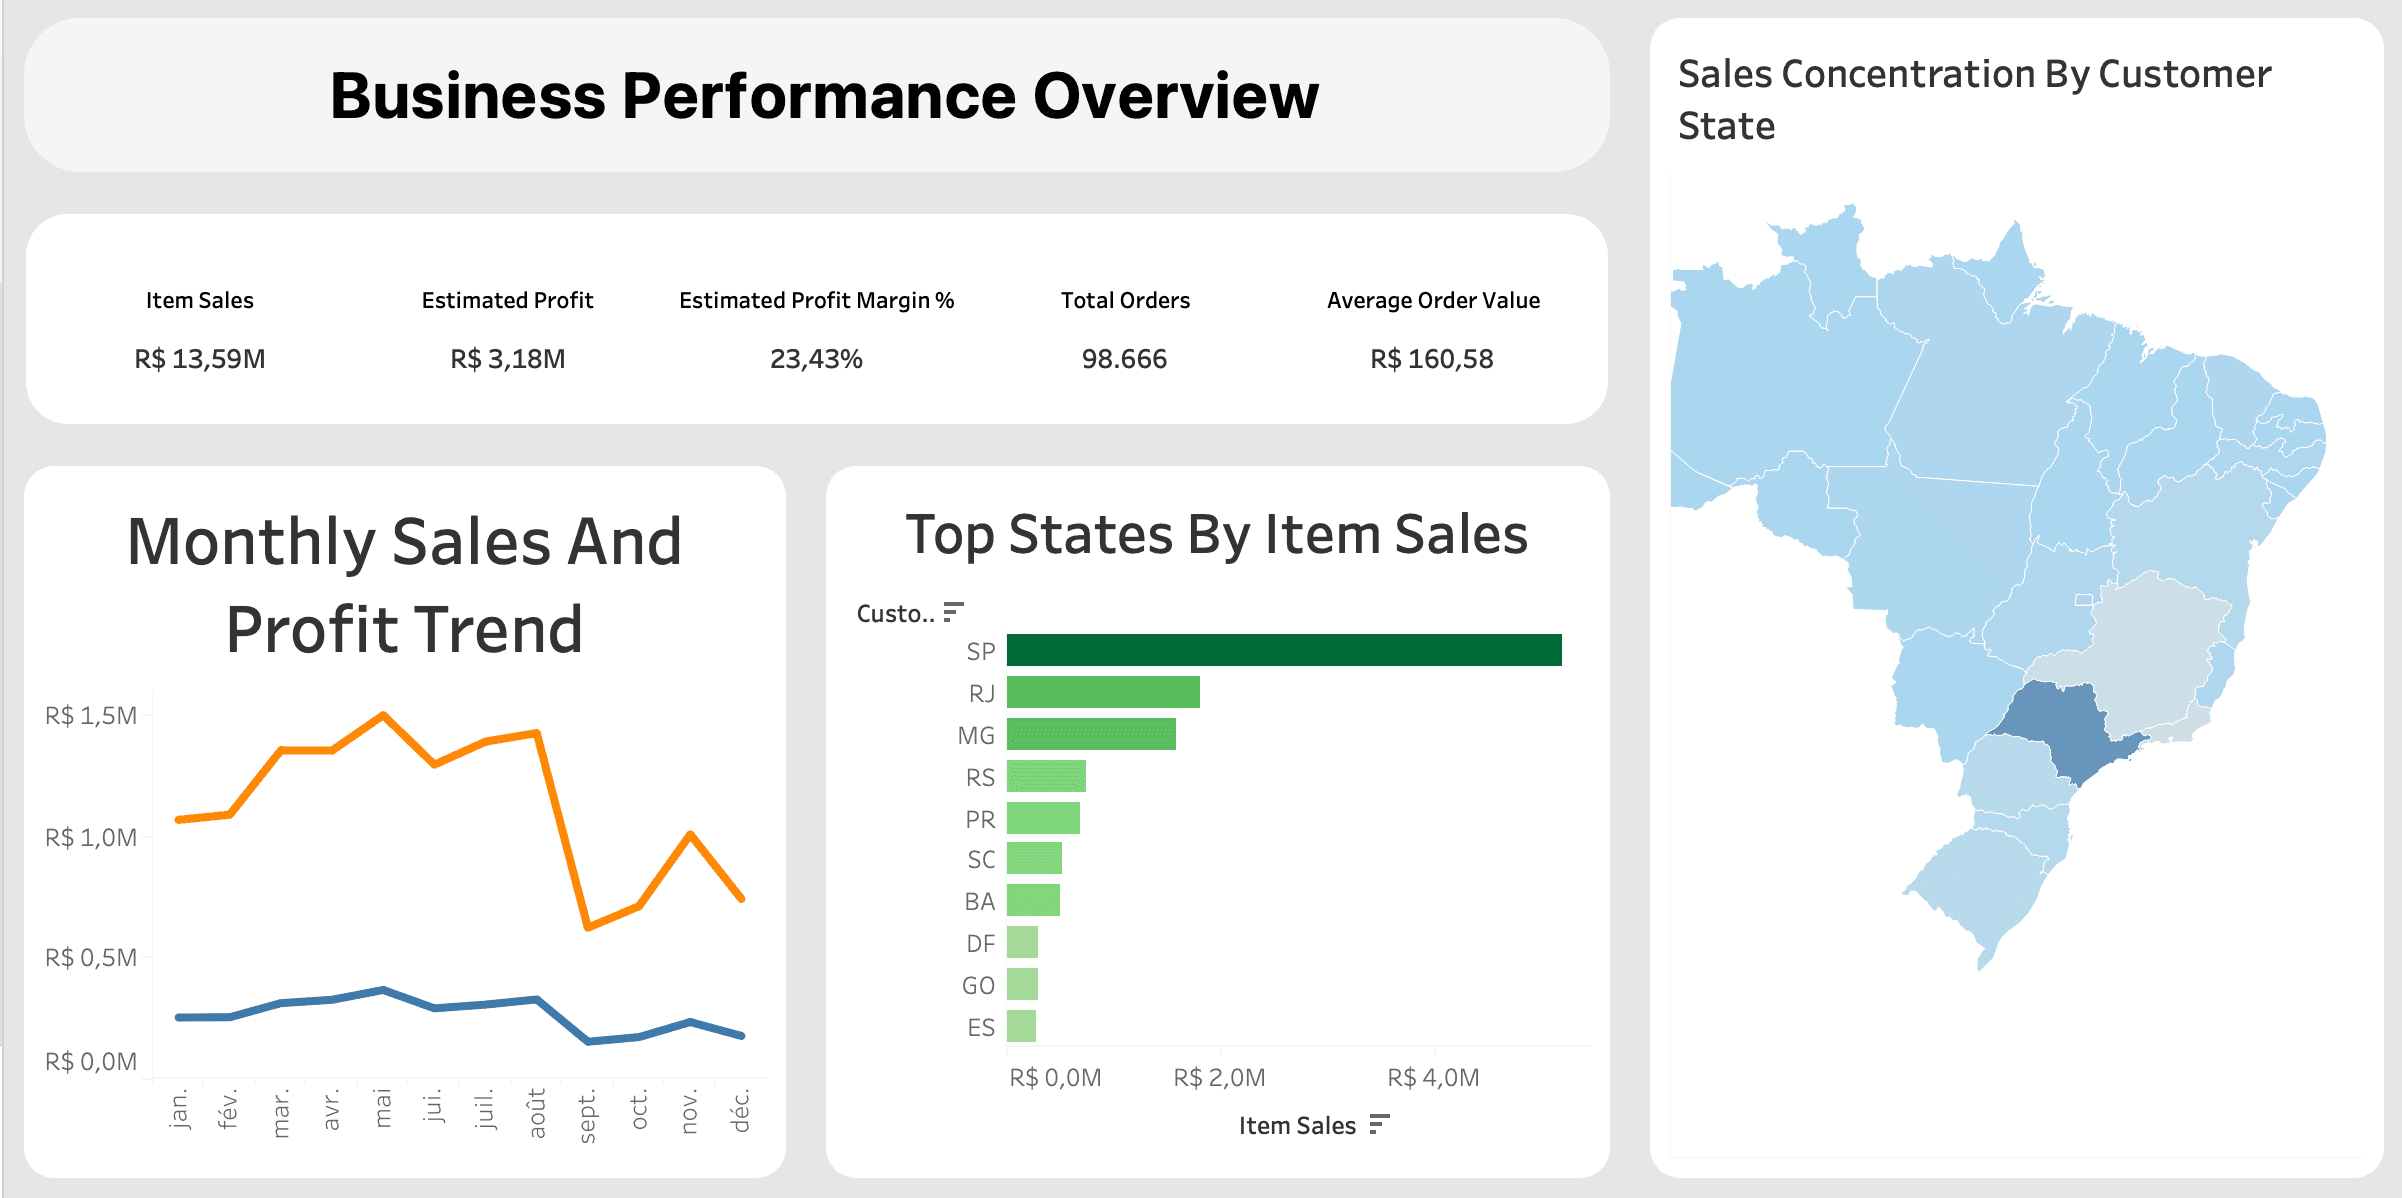
One end-to-end case study — from 9 raw CSV files to a clean star schema and three live Tableau dashboards.
Olist Marketplace Intelligence
- 01
Bronze
Raw ingestion, landed as-is
9 source CSVs
- 02
Silver
Cleaned staging layer
Encoding-normalised for MySQL
- 03
Gold
Kimball star schema, in SQL
2 fact tables · 4 dimensions
- 04
Tableau
Relationships, not joins
3 dashboards, published live
R$ 13.59M
Item sales analysed
23.43%
Estimated profit margin
112,650
Rows in the final model
Are sales translating into healthy performance over time?
Tap to view full screen
Which categories create or destroy margin?
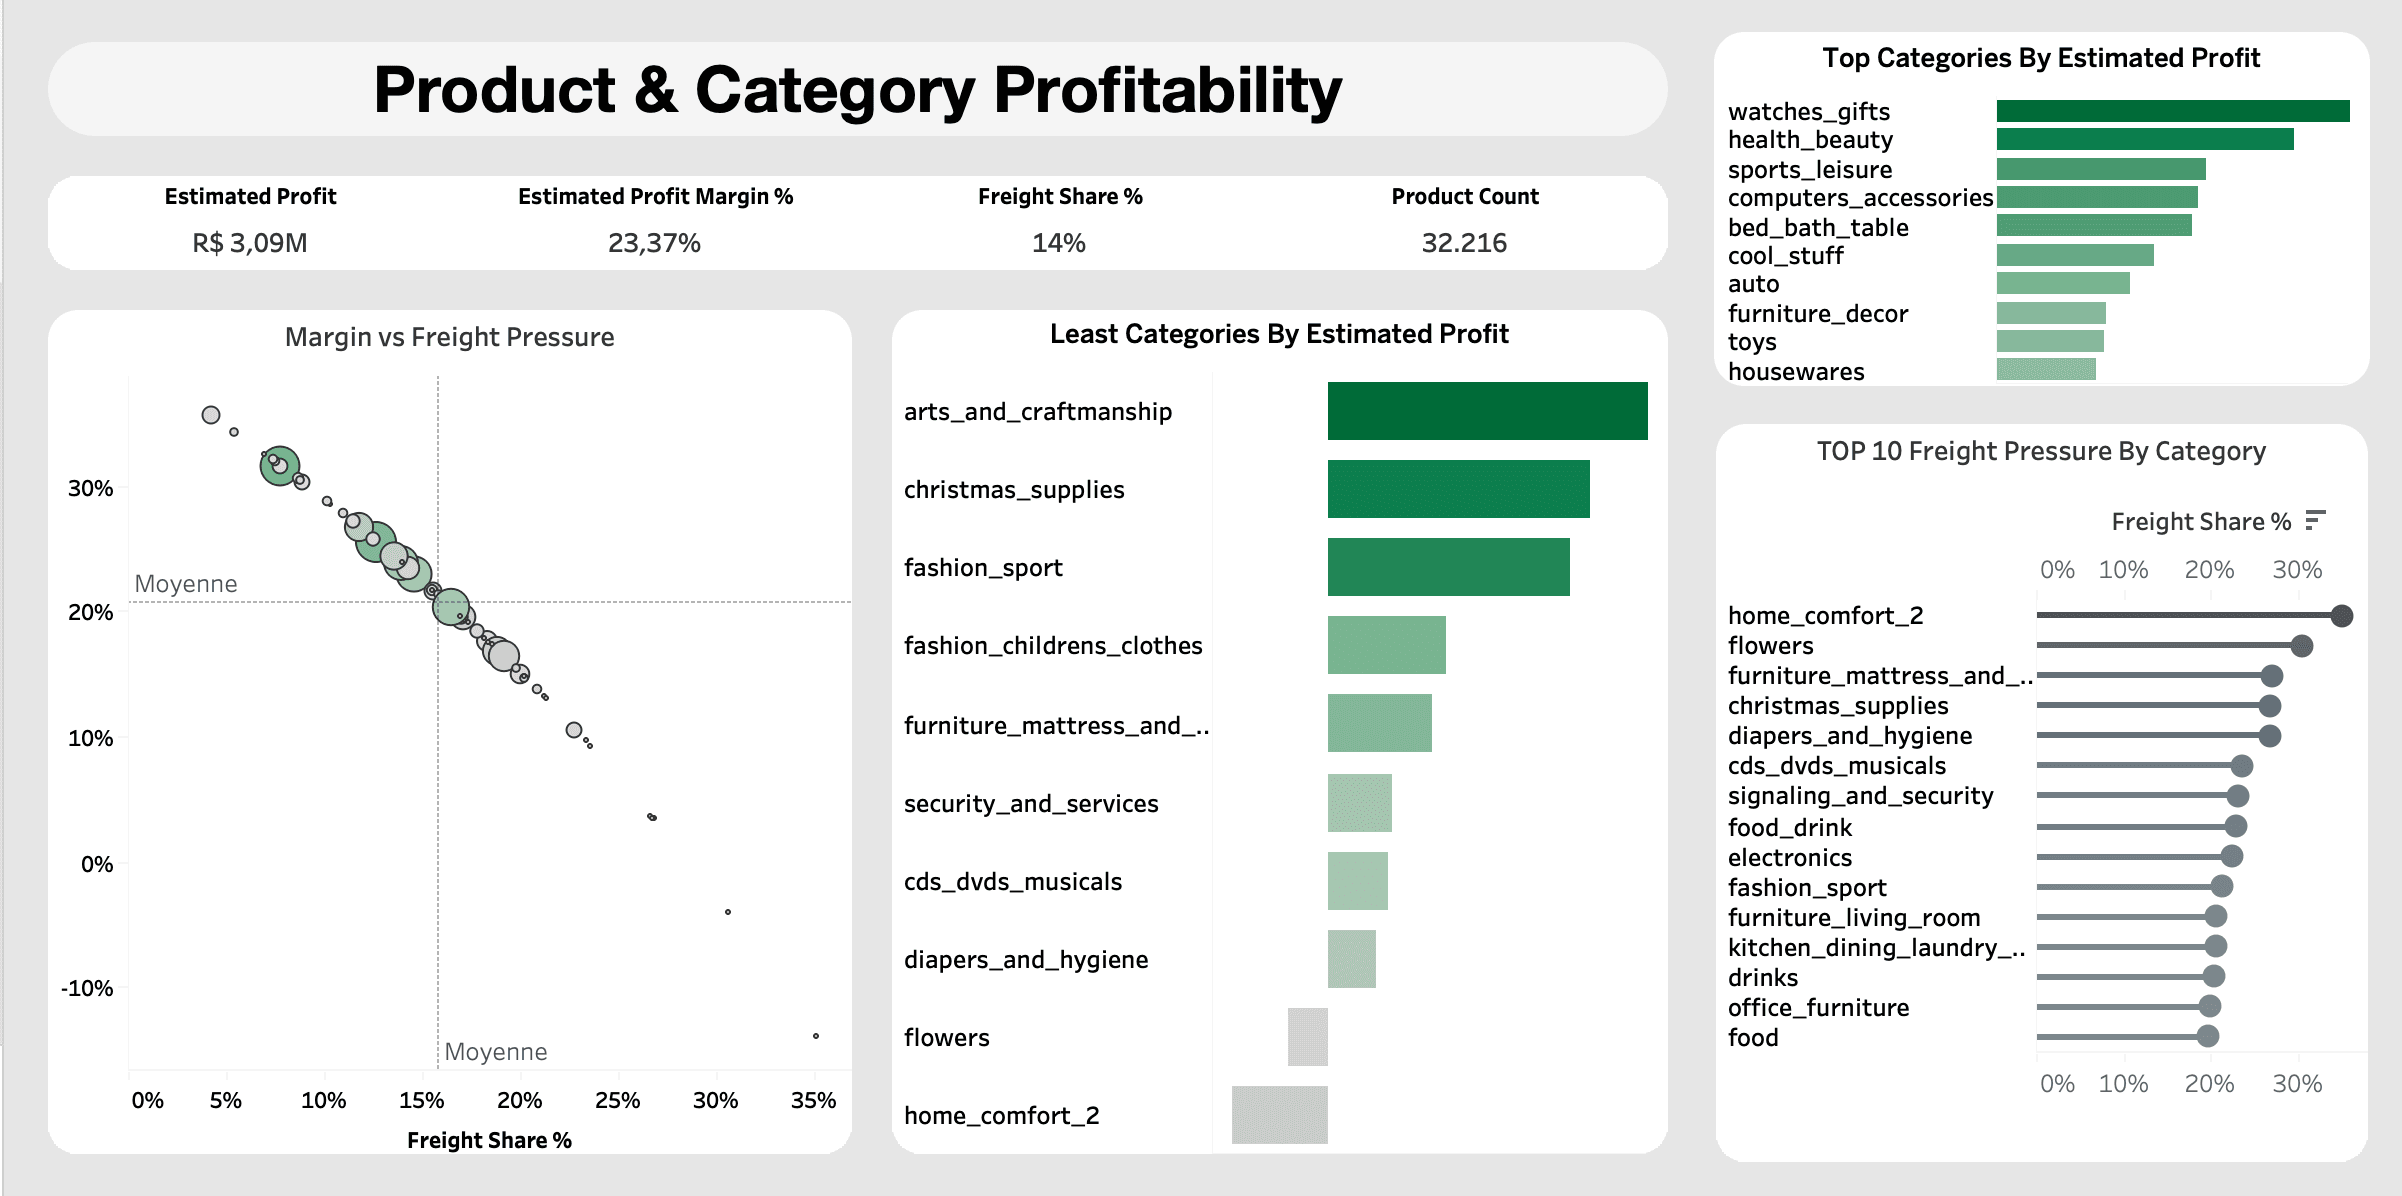
Tap to view full screen
Which regions drive demand, and where does service reliability weaken?
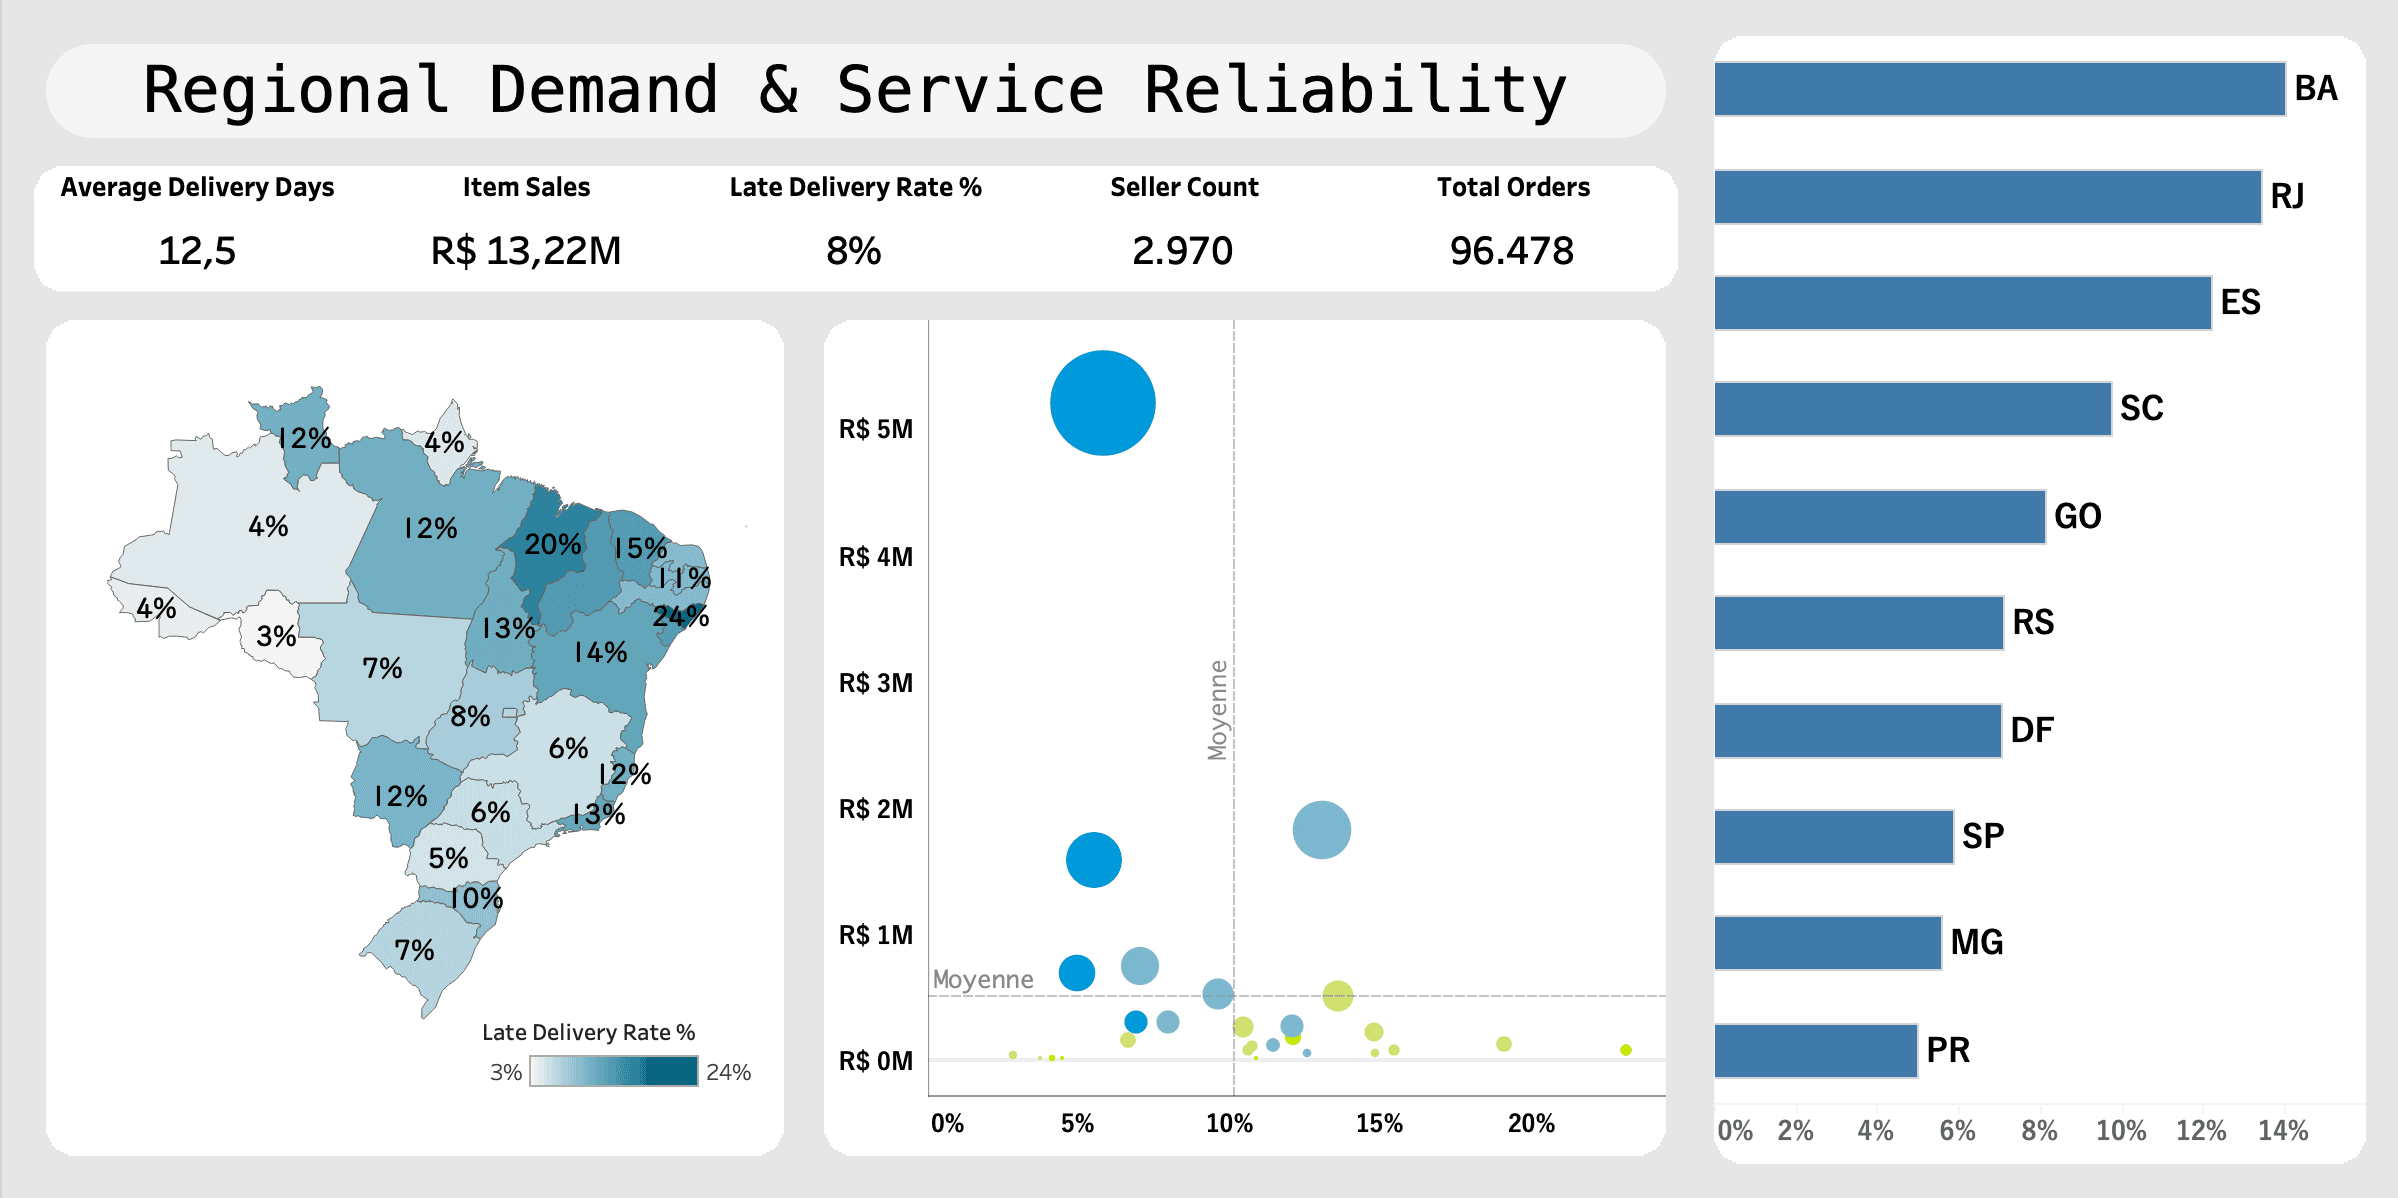
Tap to view full screen
BUILT WITH
Start With A Call. Leave With A Plan.
I build data pipelines, BI dashboards and AI-powered apps — from first sketch to production.
Book a 30-minute call. We’ll go through my work and what I could bring to your team.
Got a question, proposal, project, or want to work together on something?